RPC Network Health - April 2026
A monthly analysis of RPC block propagation latency across Ethereum infrastructure.
Executive Summary
- US-East led first-seen observations, seeing 38.95% of blocks before any other monitored region.
- First-seen visibility was concentrated in a few regions, with US-East ahead of EU-Central (17.65%) and EU-West (16.75%).
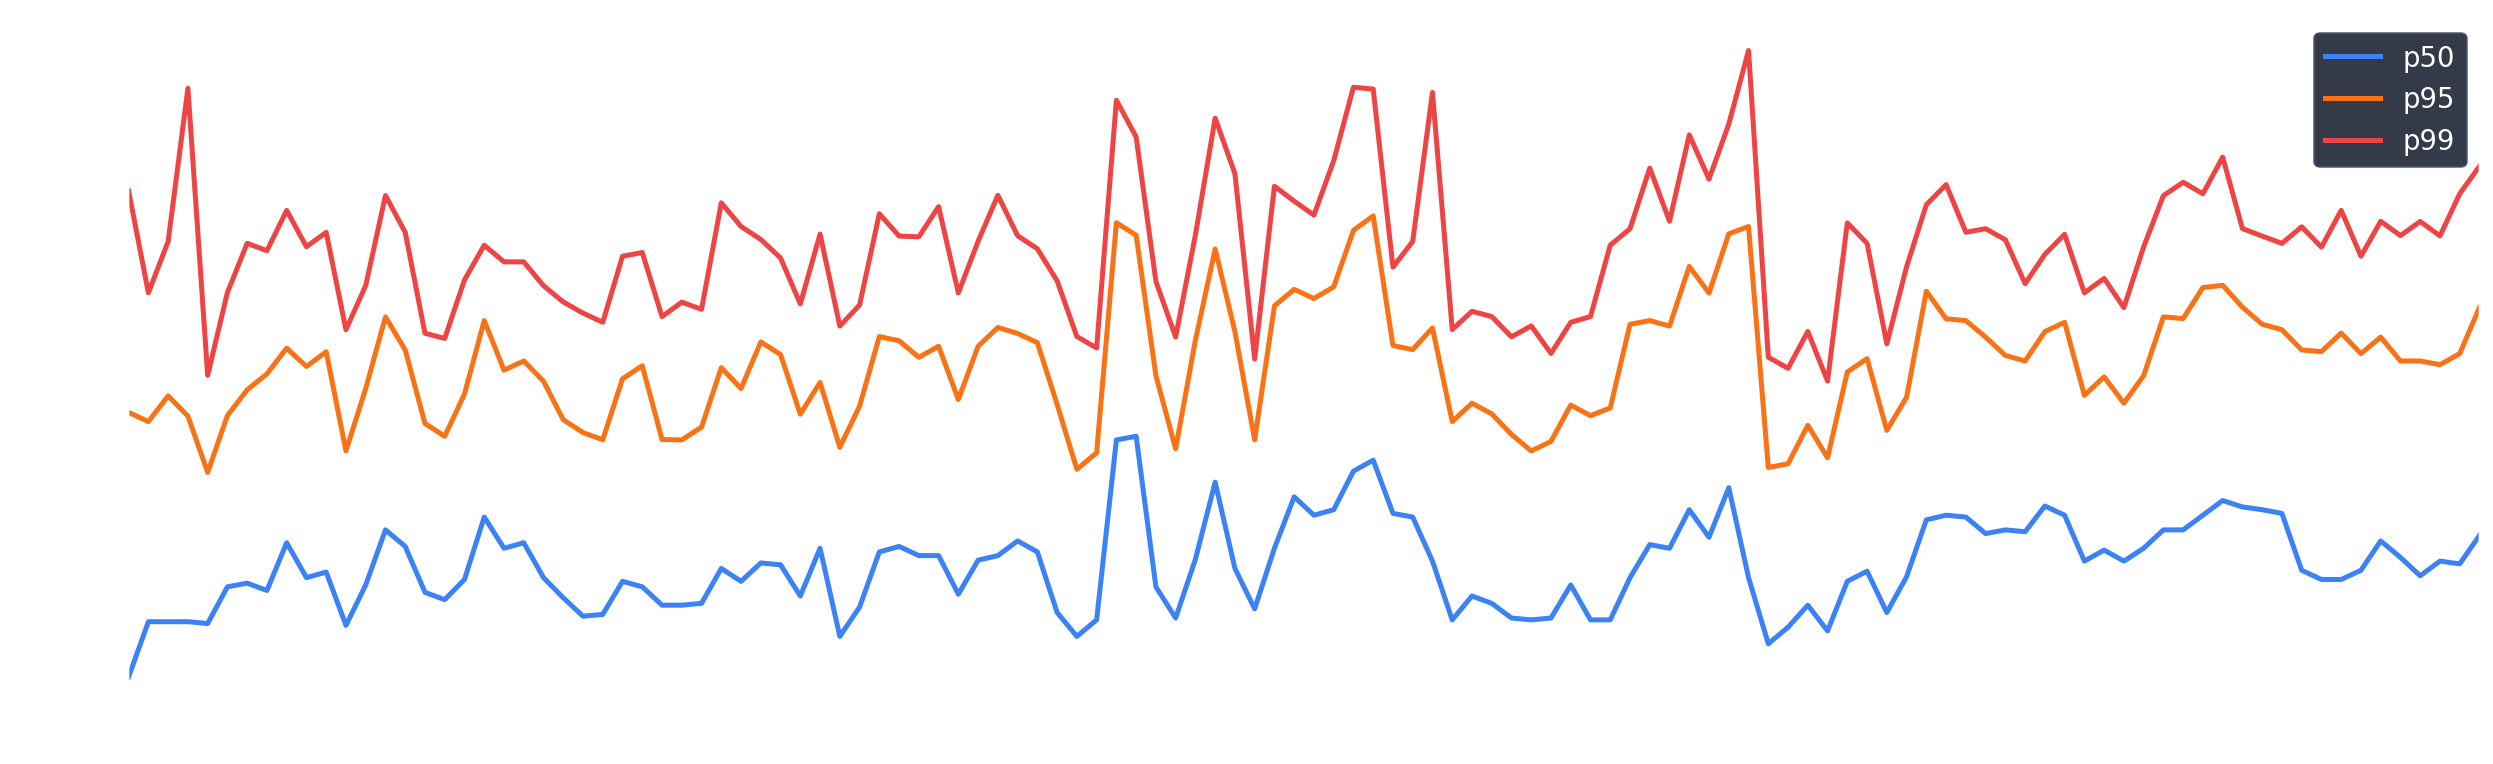
- Propagation remained tight across monitored regions, with median first-to-last regional spread at 153ms, p95 at 275ms, and p99 at 344ms.
- US-West was rarely first, accounting for only 5% of first observations.
Median Propagation
153ms
Per-block first-to-last regional spread
95th Percentile
275ms
Tail latency
99th Percentile
344ms
Extreme tail latency
First-Seen Dominance
38.95%
Top region: US-East
Coverage: 215,499 blocks were observed across all monitored regions.
Regional First-Seen Distribution
Share of blocks first observed by each region.
US-East38.95%
EU-Central17.65%
EU-West16.75%
AP-Northeast12.35%
US-Central9.30%
US-West5.00%
Block Propagation Spread Over Time
Per-block first-to-last regional propagation spread over time.
MethodologyDefinitions and sampling rules used in this report.ExpandCollapse
Methodology
Definitions and sampling rules used in this report.
Expand
Collapse
- Each block is observed from multiple geographically distributed regions using paid Ethereum RPC providers.
- For each block, the first-seen time is the earliest regional observation timestamp.
- Propagation spread is measured as the time between the first and last monitored regional observation for the same block.
- Latency percentiles are computed over per-block propagation spread values. Each block contributes one sample.
- Each region represents a cluster of RPC endpoints located within that geographic area.
- Results reflect the monitored infrastructure only and should not be interpreted as a complete view of the entire Ethereum network.